

Most Core Web Vitals advice stops at "compress your images and use a CDN." That helps, but it rarely fixes a page that has failed in Search Console for months. Real fixes come from knowing which part of a metric is slow, on which template, for which users, and then changing the one thing that moves it. This guide is for SEO leads and developers who already know what LCP, INP and CLS are and need a reliable way to diagnose and fix them.
To improve Core Web Vitals at an advanced level, start from field data in Search Console and the Chrome UX Report, find the failing metric and page template, break that metric into its parts (the four LCP subparts or the three INP phases), reproduce the problem in lab tools, fix the slowest part, and confirm the change with real-user monitoring before validating in Search Console. A page passes when it meets all three "good" thresholds at the 75th percentile of visits.
Every threshold, technique and statistic below comes from Google's web.dev documentation, Google Search Central or the HTTP Archive Web Almanac, linked where it is used. If you are earlier in the journey, our guide on how to SEO a website covers the basics first.
The Thresholds and Where Sites Stand
Google's thresholds are measured at the 75th percentile of page loads, chosen so that most visits meet the target without letting a few outliers skew the result (web.dev):
| Metric | Measures | Good | Poor |
|---|---|---|---|
| Largest Contentful Paint (LCP) | Loading | 2.5 s or less | Over 4.0 s |
| Interaction to Next Paint (INP) | Responsiveness | 200 ms or less | Over 500 ms |
| Cumulative Layout Shift (CLS) | Visual stability | 0.1 or less | Over 0.25 |
INP replaced First Input Delay as a Core Web Vital on March 12, 2024 (web.dev). Unlike FID, it reflects every interaction during a visit, not just the first.
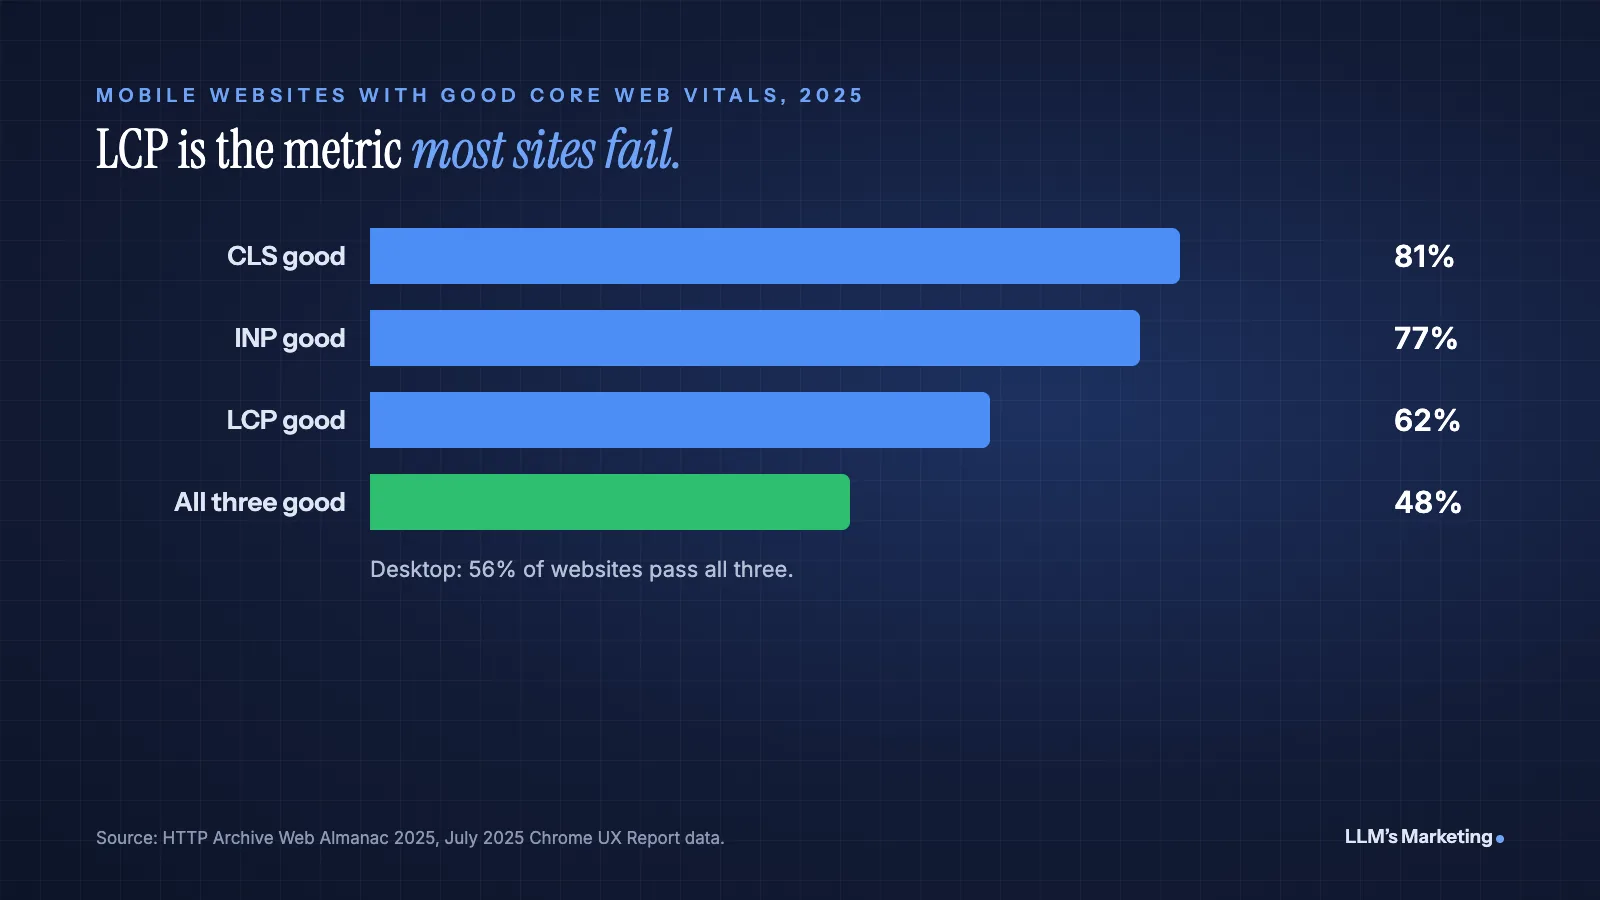
Most sites still fall short. The HTTP Archive's 2025 Web Almanac, using July 2025 Chrome UX Report data, found that 48% of mobile websites and 56% of desktop websites had good Core Web Vitals. On mobile, LCP was the hardest metric to pass (62% good), followed by INP (77%) and CLS (81%) (Web Almanac 2025).
How Much Core Web Vitals Matter for SEO
Google says "Core Web Vitals are used by our ranking systems," but also that good scores do not guarantee top rankings and that Search "always seeks to show the most relevant content, even if the page experience is sub-par" (Google Search Central). Treat Core Web Vitals as a tiebreaker in competitive results and, more importantly, as a user experience and conversion issue. Claims that a specific score triggers a "penalty" are not supported by Google's documentation.
Field Data vs Lab Data
Most diagnostic mistakes come from mixing these up.
| Source | Type | Use it for |
|---|---|---|
| Search Console Core Web Vitals report | Field (CrUX) | Which page groups pass or fail on mobile and desktop |
| PageSpeed Insights | Field (CrUX) plus lab (Lighthouse) | A single URL's real-user results, plus a lab run for clues |
| Chrome DevTools Performance panel | Lab | Finding exactly which resource, script or element is slow |
| Real-user monitoring (RUM) | Field (your own) | Attribution by page, device and interaction, and fast feedback after a release |
Search Console's report groups URLs that share a similar experience and gives each group the status of its slowest metric for that device type (Search Console Help). Lab tools like Lighthouse run on one simulated device and network, so a perfect lab score can coexist with a failing field result. Use field data to decide what to fix and lab data to work out why.
Add real-user monitoring
Field data in CrUX is aggregated over time, so it is a slow feedback loop. Google's open-source web-vitals JavaScript library lets you collect the same metrics from your own visitors, and its attribution build reports which element or interaction caused the result. A minimal setup that sends each metric to your analytics endpoint:
import { onLCP, onINP, onCLS } from 'web-vitals/attribution';

function sendToAnalytics(metric) {
  const body = JSON.stringify({
    name: metric.name,        // 'LCP', 'INP' or 'CLS'
    value: metric.value,
    rating: metric.rating,    // 'good', 'needs-improvement' or 'poor'
    id: metric.id,
    page: location.pathname,
    attribution: metric.attribution
  });
  navigator.sendBeacon('/analytics/vitals', body);
}

onLCP(sendToAnalytics);
onINP(sendToAnalytics);
onCLS(sendToAnalytics);
Report the 75th percentile by page template and device, not averages, so your numbers line up with what Google measures.
A Diagnostic Workflow That Works
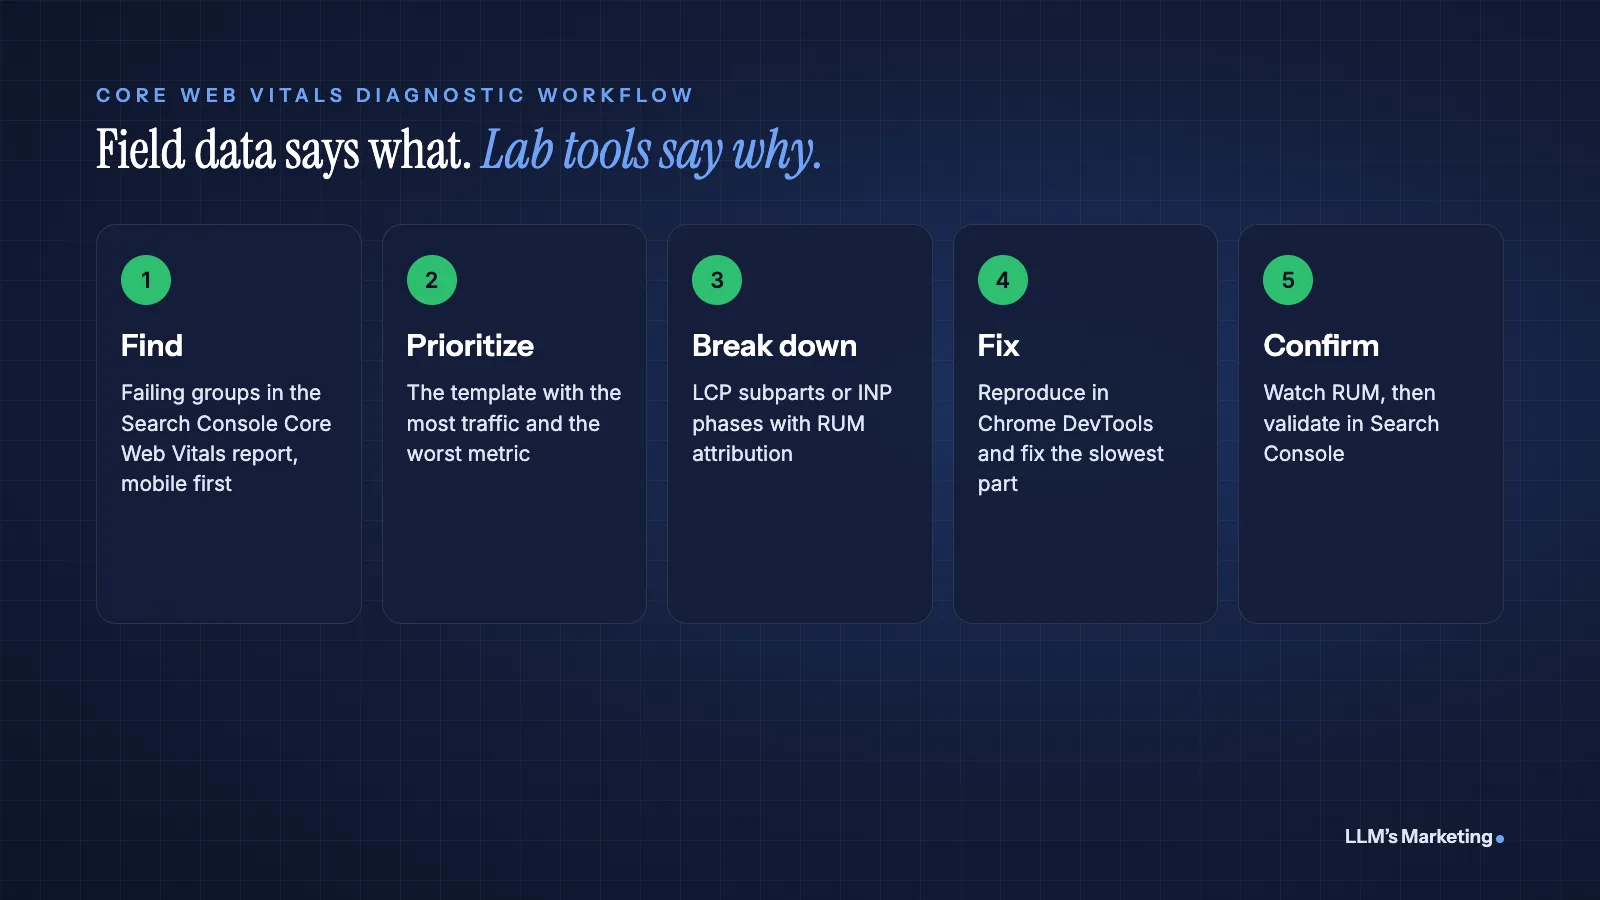
- Find failing groups. Open the Core Web Vitals report in Search Console, start with mobile, and list groups marked Poor or Needs improvement.
- Prioritize by template and traffic. A fix to a shared template (product page, article page, category page) improves every URL that uses it. Rank templates by organic traffic and revenue, then by how far they miss the threshold.
- Break the metric into parts. Use RUM attribution or a DevTools trace to see which LCP subpart or INP phase is slow. This is the step most teams skip.
- Reproduce and fix. Throttle CPU and network in DevTools to approximate your slower users, fix the slowest part, and re-test.
- Confirm and validate. Watch RUM data for the template after release. When the 75th percentile is consistently good, click Validate Fix in Search Console, which starts a 28-day monitoring period.
Fixing LCP
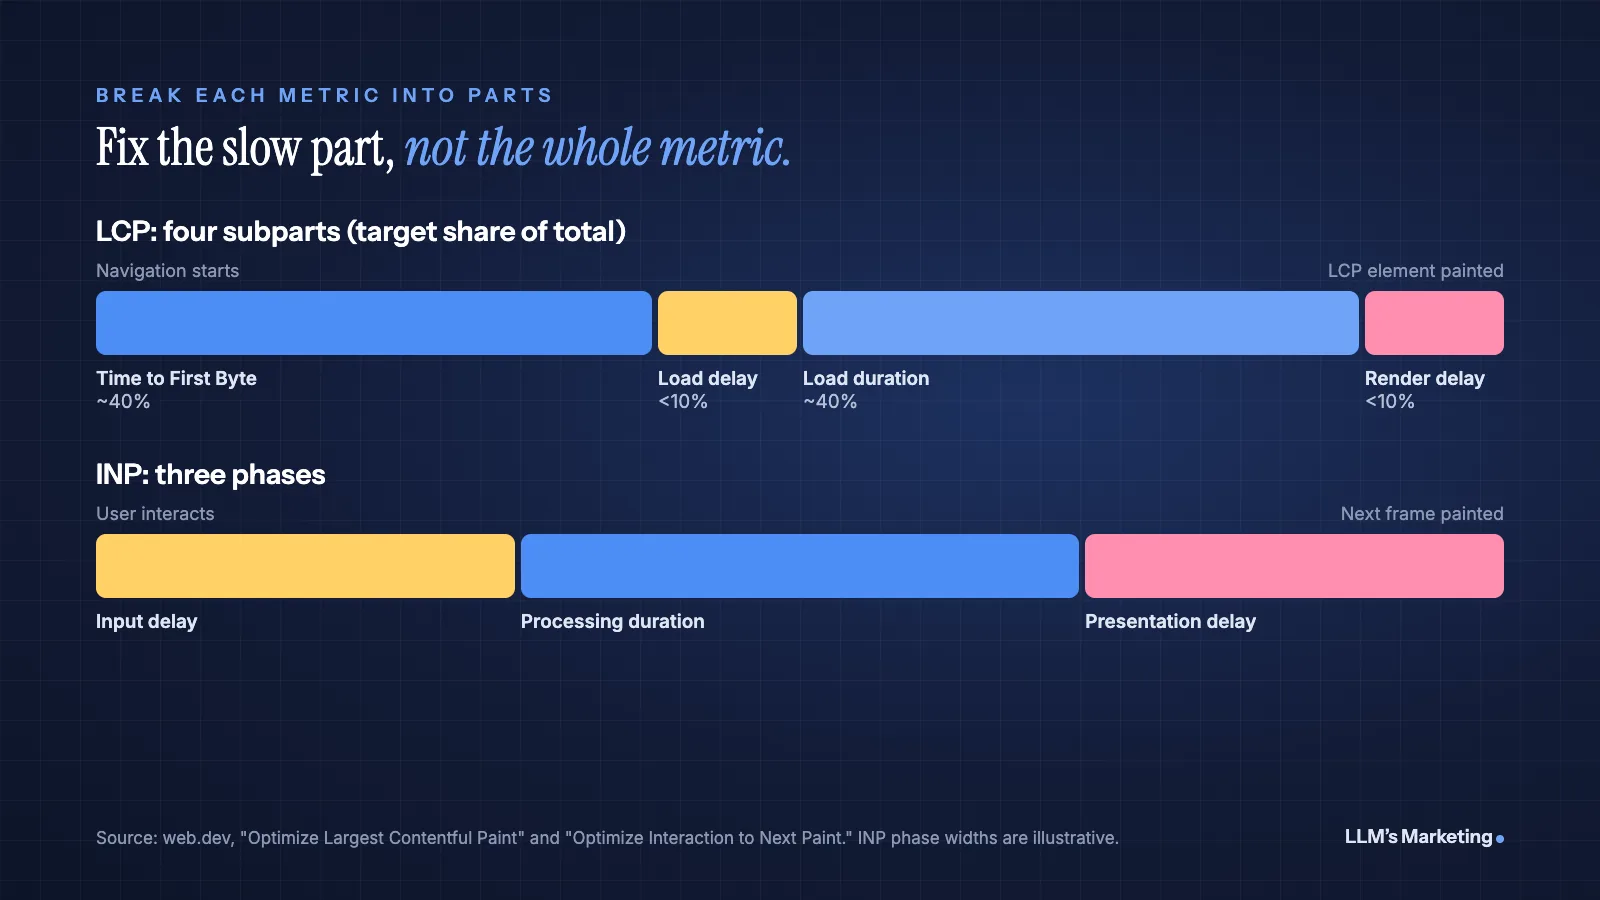
web.dev breaks LCP into four subparts that add up to the total, with rough target shares for a well-optimized page (web.dev):
| Subpart | Target share | Typical fixes |
|---|---|---|
| Time to First Byte (TTFB) | About 40% | Cache HTML at the edge, use a CDN, cut redirects, speed up server rendering and database queries |
| Resource load delay | Under 10% | Make the LCP image discoverable in the HTML, add fetchpriority="high", preload images referenced only in CSS or JavaScript, never lazy-load the LCP image |
| Resource load duration | About 40% | Smaller, modern image formats, responsive srcset, an image CDN, serving from the same origin as the HTML |
| Element render delay | Under 10% | Reduce render-blocking CSS and JavaScript, avoid hiding content until scripts run, server-render the LCP element |
web.dev is blunt about lazy loading: "Never lazy-load your LCP image." Yet the 2025 Web Almanac found that around 16% to 17% of pages still lazy-load their LCP image, while only about 17% of mobile pages use fetchpriority="high" on it. For a typical hero image, the markup should look like this:
<img src="/images/hero-1200.webp"
     srcset="/images/hero-800.webp 800w, /images/hero-1200.webp 1200w, /images/hero-1600.webp 1600w"
     sizes="(max-width: 800px) 100vw, 1200px"
     width="1200" height="675"
     alt="Describe the hero image"
     fetchpriority="high">
No loading="lazy", explicit dimensions, and a high fetch priority on that one image only. web.dev notes that setting high priority on more than one or two images makes it less useful. For the search side of images, such as alt text, filenames and image sitemaps, see our guide to image search techniques.
Fixing INP
INP covers three phases between a user's interaction and the next frame the browser paints: input delay, processing duration and presentation delay (web.dev). Each has different causes:
- Input delay: the main thread is busy when the user clicks, usually with long tasks from third-party scripts, hydration or analytics. Defer or remove non-essential scripts and break up long tasks.
- Processing duration: your event handlers do too much work. Do only what is needed to update the UI, then move the rest to a later task.
- Presentation delay: the browser takes too long to render the result, often because of a large DOM or expensive layout. Reduce DOM size and avoid layout thrashing, which happens when JavaScript changes styles and then reads layout in the same task.
Any task over 50 milliseconds is a long task (web.dev). The main technique is yielding to the main thread so the browser can respond and paint between chunks of work. scheduler.yield() returns a promise that resumes your code in a new task, and web.dev recommends a setTimeout fallback where it is not supported:
function yieldToMain() {
  if (globalThis.scheduler?.yield) {
    return scheduler.yield();
  }
  return new Promise((resolve) => setTimeout(resolve, 0));
}

button.addEventListener('click', async () => {
  updateButtonState();   // visible feedback first
  await yieldToMain();   // let the browser paint
  saveToServer();        // heavier work afterwards
  await yieldToMain();
  sendAnalytics();
});
Fixing CLS
Layout shifts happen when content moves after it first appears. The common causes and fixes from web.dev (web.dev):
- Images and video without dimensions: always set
widthandheight, or reserve space with CSSaspect-ratio. - Ads and embeds: reserve space with
min-heightoraspect-ratio, and do not collapse the slot if no ad fills it. - Injected content: avoid inserting banners or notices above existing content without reserving space; load more items only when the user asks.
- Web fonts: use
font-display: optionalto avoid a re-layout, preload key fonts and match fallback font metrics with font override descriptors. - Animations: animate with
transforminstead of properties liketopandleftthat trigger layout. - Back/forward cache: keeping pages eligible for the bfcache restores them instantly on back and forward navigation, which web.dev calls a highly effective way to keep CLS low.
/* Reserve space for a responsive ad or embed slot */
.ad-slot {
  min-height: 250px;
}

/* Keep video embeds from shifting the layout */
.video-embed {
  aspect-ratio: 16 / 9;
  width: 100%;
}
Prioritizing Fixes by Business Impact
Not every failing URL deserves the same effort. Score each failing template on three factors, then work from the top:
- Reach: how many sessions and how much revenue or lead volume the template carries.
- Gap: how far the 75th percentile is from "good." A page at 2.7 seconds LCP is a quicker win than one at 6 seconds.
- Effort: whether the fix is a template change (one fix, many pages) or page-by-page work.
Templates with high reach, a small gap and a template-level fix go first. Estimate business value from your own analytics rather than industry averages, and measure the before-and-after conversion rate for the template once the fix ships.
Prevent Regressions
- Performance budgets in CI: run Lighthouse CI on key templates in pull requests and fail builds that exceed agreed budgets for script size or lab metrics.
- Third-party governance: require a performance review before adding tags, chat widgets or ad scripts, which often cause INP and CLS problems.
- RUM alerts: alert when a template's 75th percentile crosses a threshold, so regressions are caught in days rather than after Search Console flags them.
Core Web Vitals and AI Search
Google says there are no special requirements to appear in AI Overviews or AI Mode beyond standard SEO best practices, which include page experience. Fast, stable pages also matter when visitors arrive from AI answers: if a cited page is slow, the visitor who clicked through is easier to lose. Our GEO vs SEO guide covers how technical health fits into AI visibility.
Frequently Asked Questions
What are good Core Web Vitals scores?
A page is good when, at the 75th percentile of visits, Largest Contentful Paint is 2.5 seconds or less, Interaction to Next Paint is 200 milliseconds or less and Cumulative Layout Shift is 0.1 or less. Poor is above 4 seconds, 500 milliseconds and 0.25 respectively.
Why is my PageSpeed score good but Search Console says poor?
The PageSpeed performance score comes from a lab test on one simulated device and connection. Search Console uses field data from real Chrome users, who may be on slower phones and networks. Search Console also groups similar URLs, so one slow template can affect many pages. Fix what the field data shows.
Do Core Web Vitals affect rankings?
Google says Core Web Vitals are used by its ranking systems, but good scores do not guarantee top rankings and relevance comes first. They matter most when several pages are similarly relevant, and they always matter for user experience and conversions.
How long does it take for Core Web Vitals fixes to show?
Lab tools show changes immediately. Field data takes longer because it is aggregated from real visits over time. When you validate a fix in Search Console, Google monitors the affected URLs for 28 days before marking the issue fixed. Your own real-user monitoring will show the effect much sooner.
What replaced First Input Delay?
Interaction to Next Paint (INP) replaced First Input Delay as a Core Web Vital on March 12, 2024. INP measures the responsiveness of all interactions during a visit, not only the first one.
Where to Start
Open the Core Web Vitals report in Search Console, pick the mobile template with the most traffic that fails, and break its worst metric into parts. For most sites that will be LCP, and the first things to check are whether the LCP image is lazy-loaded, whether it has fetchpriority="high" and how long the server takes to respond. Add the web-vitals library so you can see the effect of each fix within days.
If you would like help, book a free call, reach us through the contact page or send your details below. Our founder, Mohd Adil Kazmi, will review your Core Web Vitals and technical SEO and reply with the fixes that will move the needle first. You can also explore our AI SEO and content service or all services.
Failing Core Web Vitals in Search Console?
Send your website and I'll review your Google Business Profile, service pages and AI visibility, then reply personally with the first fixes I would make.